In 2025 the Schwab U.S. Dividend Equity ETF (SCHD) is still a good way to invest for people who want a mix of stable dividend income and long-term growth. Perfect for investments that focus on making money SCHD’s strategy is to invest in companies that have a past of paying dividends and are in good financial health.
Short-term instability can be caused by market changes and reorganization events like the upcoming 2025 index adjustments. However, SCHD has a good track record that suggests it will still continue to be a good long-term investment. Before putting money into something investors should think carefully about their financial goals and how much risk they are willing to take.
SCHD Historical performance
SCHD has a history of strong returns over a wide range of time periods, which shows that it could be a good long-term investment. To understand more about the dividends SCHD pays, you can refer to the detailed information on dividend payouts. Here is a quick look at how the ETF has done:
1. Annual Returns (Investment Price)
| Year | Annual Return (%) |
| 2024 | 11.67 |
| 2023 | 4.57 |
| 2022 | -3.23 |
| 2021 | 29.87 |
| 2020 | 15.08 |
| 2019 | 27.28 |
| 2018 | -5.56 |
| 2017 | 20.83 |
| 2016 | 16.44 |
| 2015 | -0.31 |
2. Trailing Returns (Total Return % – Price)
| Period | Total Return (%) |
| 1-Day | 0.15 |
| 1-Week | 3.64 |
| 1-Month | 4.47 |
| 3-Month | 3.34 |
| YTD | 2.01 |
| 1-Year | 10.33 |
| 3-Year | 8.29 |
| 5-Year | 13.63 |
| 10-Year | 11.46 |
| Earliest Available | 12.56 |
3. SCHD Annual Dividends and Growth
| Year | Total Amount | % Change Year-over-Year |
|---|---|---|
| 2025 | 0.509 | 6.4% |
| 2024 | 0.9944 | 12.2% |
| 2023 | 0.886 | 3.8% |
| 2022 | 0.8538 | -9.7% |
| 2021 | 0.9453 | 39.8% |
| 2020 | 0.6761 | 17.6% |
| 2019 | 0.5747 | 19.8% |
| 2018 | 0.4798 | 7% |
| 2017 | 0.4486 | 7% |
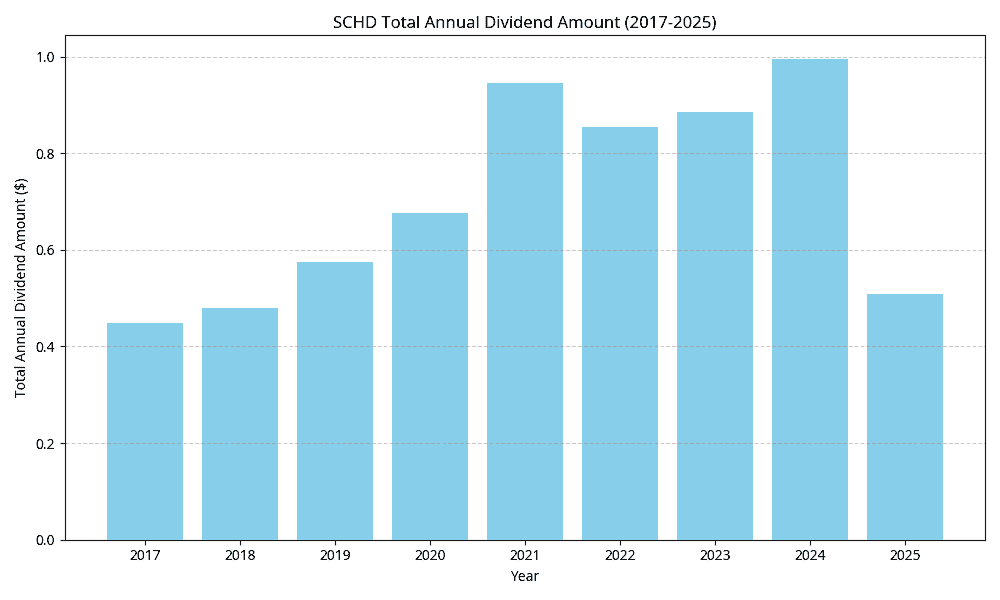
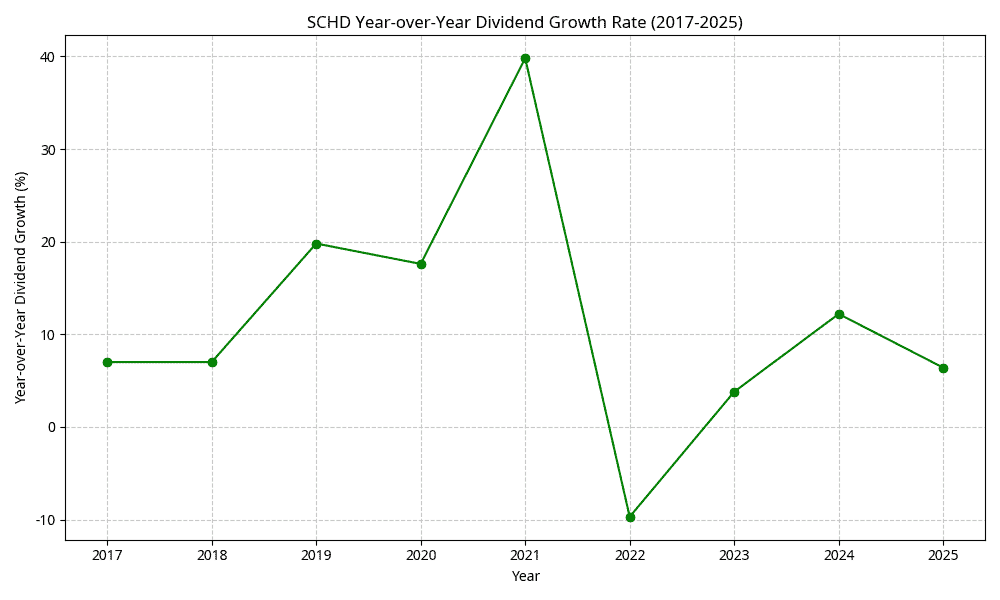
Even though there have been problems like the market drop in 2022 which was mostly caused by COVID-19’s effects on the global economy, SCHD’s long-term outlook is still good. This makes it a strong choice for investors looking for stability and growth.
4. SCHD Historical Dividends: Quarterly and Yearly Overview
| Type | Date | Amount | Year-over-Year Change (%) |
|---|---|---|---|
| Quarterly | 2025-06-25 | 0.2602 | |
| Quarterly | 2025-03-26 | 0.2488 | |
| Yearly | 2025 | 0.509 | 6.4 |
| Quarterly | 2024-12-11 | 0.2645 | |
| Quarterly | 2024-09-25 | 0.2515 | |
| Quarterly | 2024-06-26 | 0.2747 | |
| Quarterly | 2024-03-20 | 0.2037 | |
| Yearly | 2024 | 0.9944 | 12.2 |
| Quarterly | 2023-12-06 | 0.2474 | |
| Quarterly | 2023-09-20 | 0.2182 | |
| Quarterly | 2023-06-21 | 0.2216 | |
| Quarterly | 2023-03-22 | 0.1988 | |
| Yearly | 2023 | 0.886 | 3.8 |
| Quarterly | 2022-12-07 | 0.2345 | |
| Quarterly | 2022-09-21 | 0.2122 | |
| Quarterly | 2022-06-22 | 0.2346 | |
| Quarterly | 2022-03-23 | 0.1725 | |
| Yearly | 2022 | 0.8538 | -9.7 |
| Quarterly | 2021-12-08 | 0.2066 | |
| Quarterly | 2021-09-22 | 0.1957 | |
| Quarterly | 2021-06-23 | 0.1799 | |
| Quarterly | 2021-03-24 | 0.1675 | |
| Yearly | 2021 | 0.9453 | 39.8 |
| Quarterly | 2020-12-10 | 0.2005 | |
| Quarterly | 2020-09-23 | 0.1810 | |
| Quarterly | 2020-06-24 | 0.1473 | |
| Quarterly | 2020-03-25 | 0.1473 | |
| Yearly | 2020 | 0.6761 | 17.6 |
| Quarterly | 2019-12-12 | 0.1553 | |
| Quarterly | 2019-09-25 | 0.1618 | |
| Quarterly | 2019-06-26 | 0.1403 | |
| Quarterly | 2019-03-20 | 0.1173 | |
| Yearly | 2019 | 0.5747 | 19.8 |
| Quarterly | 2018-12-12 | 0.1351 | |
| Quarterly | 2018-09-25 | 0.1223 | |
| Quarterly | 2018-06-26 | 0.1352 | |
| Quarterly | 2018-03-16 | 0.0872 | |
| Yearly | 2018 | 0.4798 | 7.0 |
| Quarterly | 2017-12-18 | 0.1149 | |
| Quarterly | 2017-09-18 | 0.1146 | |
| Quarterly | 2017-06-19 | 0.1104 | |
| Quarterly | 2017-03-20 | 0.1086 | |
| Yearly | 2017 | 0.4486 | 7.0 |
| Quarterly | 2016-12-19 | 0.1329 | |
| Quarterly | 2016-09-19 | 0.0813 | |
| Quarterly | 2016-06-20 | 0.1058 | |
| Quarterly | 2016-03-21 | 0.0994 | |
| Quarterly | 2015-12-21 | 0.0905 | |
| Quarterly | 2015-09-21 | 0.0996 | |
| Quarterly | 2015-06-22 | 0.1021 | |
| Quarterly | 2015-03-23 | 0.0900 | |
| Quarterly | 2014-12-22 | 0.0918 | |
| Quarterly | 2014-09-22 | 0.0848 | |
| Quarterly | 2014-06-23 | 0.0898 | |
| Quarterly | 2014-03-24 | 0.0826 | |
| Quarterly | 2013-12-23 | 0.0830 | |
| Quarterly | 2013-09-23 | 0.0769 | |
| Quarterly | 2013-06-24 | 0.0750 | |
| Quarterly | 2013-03-18 | 0.0664 | |
| Quarterly | 2012-12-24 | 0.0860 | |
| Quarterly | 2012-09-17 | 0.0693 | |
| Quarterly | 2012-06-24 | 0.0693 | |
| Quarterly | 2012-03-19 | 0.0693 | |
| Quarterly | 2011-12-22 | 0.0693 | |
| Quarterly | 2011-09-22 | 0.0693 |
How to Understand SCHD’s Base Index and Holdings
SCHD follows the Dow Jones U.S. income 100TM Index, which lists U.S. companies with strong income yields and sound finances. The ETF invests in companies that have been chosen for their ability to keep and grow their dividends. This makes sure that the portfolio is made up of truly sound companies.
Criteria for choosing an index:
1. Cash Flow to Total Debt number: This number makes sure that a company has enough operational cash flow to pay its debts.
The return on equity (ROE) of a company shows how well it can make money from shareholder stock.
2. Dividend Yield: Looks at companies that pay out big payouts every year compared to the price of their shares.
3. 5-Year Dividend Growth Rate: This number shows how well a company has done at increasing payouts over the last five years.
Top Holdings (as of July 3, 2025)
| Ticker | Company Name |
| TXN | Texas Instruments Inc |
| COP | ConocoPhillips |
| CVX | Chevron Corp |
| CSCO | Cisco Systems Inc |
| MRK | Merck & Co. Inc |
| PEP | PepsiCo Inc |
| AMGN | Amgen Inc |
| ABBV | AbbVie Inc |
| VZ | Verizon Communications Inc |
| HD | Home Depot Inc |
Sector Allocation (as of May 31 2025)
| Sector | Weight (%) |
| Financials | 20.90 |
| Industrials | 17.50 |
| Health Care | 15.80 |
| Consumer Staples | 13.20 |
| Information Technology | 10.10 |
| Energy | 9.50 |
| Communication Services | 5.10 |
| Materials | 3.90 |
| Utilities | 2.80 |
| Consumer Discretionary | 1.20 |
Frequently Asked Questions
What does a SCHD 10 year return mean?
×Recent data shows that the SCHD 10 year return is about 13.52% per year. This return shows how the Schwab U.S. Dividend Equity ETF has grown. This fund buys good stocks that pay dividends. Over the past few years, SCHD has done very well thanks to its diverse collection of U.S. companies with strong finances and steady dividend payments.
Is it likely that a SCHD will go up?
+There is no way to know for sure how an investment will do, but SCHD is likely to do well because it focusses on high-quality stocks that pay dividends. Analysts often think that SCHD is a good long term investment because it has done well in the past has a high dividend return and has the potential for capital growth. Short term profits could be affected by market volatility, though.
What is the 2025 SCHD dividend?
+The exact SCHD income for 2025 is not known yet because it depends on how well the fund has done and how much money it makes from its holdings. SCHD, on the other hand, has traditionally paid payments every three months, with an annualised yield of around 3.5% to 4%. Investors can count on a steady stream of dividends, though the amount may change depending on the market.
What is the yearly pay for a SCHD?
+Based on its most recent dividends SCHD usually gives a 3.5% to 4% yearly yield. For instance if you put 10,000 won into SCHD, you can expect a yearly dividend payment of around 350 to 400 won. However this amount can change based on how well the ETF does and how much dividends it gets from the companies that make up its portfolio.
How much does SCHD earn each year?
+Most of the time SCHD has a yearly yield of 3.5% to 4%. This yield is found by adding up the total profits paid out over the last year and the price of a share right now. People who are interested in income will like SCHD’s yield because it offers a steady stream of dividend payments which is especially helpful when interest rates are low.
How do you find the CAGR for SCHD?
+Since 2008 SCHD has grown at a rate of about 13.52% per year which is called its Compound Annual Growth Rate (CAGR). This is the average yearly return which takes into account both price growth and reinvesting dividends. The strong CAGR shows that SCHD has consistently done a good job of giving long term buyers both growth and income. On the other side past success doesn’t always mean future returns.