How ETF Prices are Determined by FED Policy in 2025?
In 2025 investors are facing a big problem in dealing with market uncertainty caused by the...
Free Financial Tools
Calculate your potential dividend income from Schwab U.S. Dividend Equity ETF (SCHD) investments and harness the power of compound growth over time.
$2.48
Latest Quarterly Dividend
9.33%
10-Year Dividend CAGR
10+ Years
Historical Data Available
Use our comprehensive calculator to project your SCHD investment returns and dividend income
Understand when and how much you can expect to be paid from your SCHD investments.
| Quarter | Ex-Dividend Date | Payment Date |
|---|---|---|
| Q1 2025 | March 26, 2025 | March 31, 2025 |
| Q2 2025 | June 25, 2025 | June 30, 2025 |
| Q3 2025 | September 24, 2025 | September 29, 2025 |
| Q4 2025 | December 10, 2025 | December 15, 2025 |
Dates are estimates and based on historical data. Final dates will be confirmed by Schwab.
| Year | Share Price | Shares Owned | Annual Dividend | Portfolio Value | Yield on Cost |
|---|
Comprehensive financial tools to optimize your SCHD investments and maximize returns
Professional-grade tools designed for serious investors seeking accurate dividend projections
Get instant dividend projections with our high-performance calculator using real SCHD historical data.
Full-featured calculator on all devices with responsive design for smartphones, tablets, and desktops.
Beautiful charts for quick insight into your investment growth with clear visual breakdowns.
Uses actual historical SCHD data for realistic projections based on past performance.
🗓️ March 2025 SCHD Dividend Information (Q1)
📅 Ex-Dividend Date: March 26 (Wednesday) 💰 Dividend Payment Date: March 31 (Monday) ✅ Quarterly Dividend: $0.2488 (Confirmed)| Quarter | Ex-Date | Pay Date |
|---|---|---|
| Q1 | March 26, 2025 | March 31, 2025 |
| Q2 | June 25, 2025 | June 30, 2025 |
| Q3 | September 24, 2025 | September 29, 2025 |
| Q4 | December 10, 2025 | December 15, 2025 |
Below are the top 10 holdings of SCHD as of June 14, 2025, showing their current weighting within the ETF.
| Ticker | Company Name | Weight (%) |
|---|---|---|
| COP | ConocoPhillips | 4.51% |
| LMT | Lockheed Martin Corp. | 4.20% |
| KO | Coca-Cola Co. | 4.19% |
| VZ | Verizon Communications Inc. | 4.15% |
| MO | Altria Group Inc. | 4.15% |
| CSCO | Cisco Systems Inc. | 4.15% |
| TXN | Texas Instruments Inc. | 4.13% |
| CVX | Chevron Corp. | 4.00% |
| AMGN | Amgen Inc. | 3.86% |
| HD | The Home Depot Inc. | 3.80% |
Among the sectors included in SCHD's portfolio, Energy and Consumer Staples have the largest allocations. The relatively low weight of the IT sector provides stability by reducing volatility.
| Sector | Allocation (%) |
|---|---|
| Energy | 21.08% |
| Consumer Staples | 19.06% |
| Health Care | 15.68% |
| Industrials | 12.45% |
| Financials | 8.36% |
| Information Technology | 7.87% |
| Consumer Discretionary | 7.86% |
| Communication Services | 4.80% |
| Materials | 2.80% |
| Utilities | 0.04% |
The sector allocation has seen significant changes with Energy now being the largest sector at 21.08%, followed by Consumer Staples at 19.06%. This represents a shift from the previous allocation where Financials had a higher weight.
The updated sector allocation reflects SCHD's focus on stable dividend-paying companies. Energy companies have increased their dividend programs, making them a larger part of the ETF.
Visualize how dividend yield is calculated and its impact on your income.
This means that for each share of the SCHD ETF, you, as an investor, would earn approximately $2.57 / share in annual dividends.
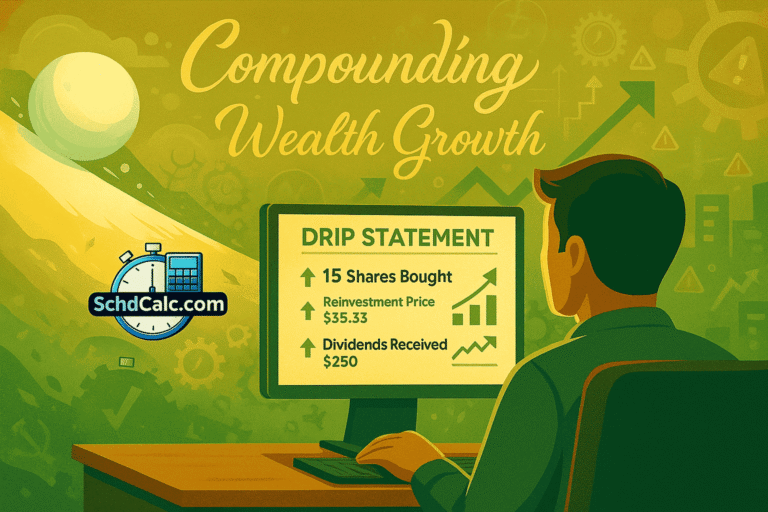
Maximizing the returns from the investment is a key strategy for many investors who want to grow their wealth through dividends. The SCHD Dividend Calculator (also known as DRIP) helps investors by showing how their reinvesting dividends can help increase total returns for a long period. So when dividends are reinvested to purchase more shares of SCHD, you will get the compounding benefit to grow your portfolio. This reinvestment strategy leverages the power of compound interest and growth, making your investments work harder for you.
One of the most powerful investment strategies for building wealth is creating a dividend snowball. The SCHD Dividend Calculator is designed to help investors track the growth of their dividends and visualize how their portfolio can expand over time with reinvested earnings.
The idea behind a dividend snowball is simple: by reinvesting dividends, you buy more shares, which then generate more dividends in the next period. If you are planning to invest for the long term, then this leads to a snowball effect, where your dividends grow at an increasing rate.
Suppose you start with 100 shares of SCHD, and the SCHD is providing a yield of $2.50 per share annually. Then, purchasing the 100 shares would generate $250 in dividends in the first year. If you reinvest those dividends into more shares, your portfolio grows, and in the following year, you earn more dividends due to the larger number of shares.
The SCHD Dividend Calculator makes it easy to project how much your income will grow as your stock holdings increase, so you must thank reinvestment. This approach relies on compound growth, which makes it a powerful tool for long-term investors.


Get answers to common questions about SCHD dividend calculations and investing
It provides reasonably accurate projections if you fed current SCHD share price and dividend growth inputs. It relies on historical data but future market conditions can differ. It is best for rough estimates, but it is not guaranteed predictions.
With the help of DRIP (Dividend Reinvestment Plan), you can payout automatically buy more shares. If you don't need the money right now then it is a good idea to invest in it because it will grow over time.
SCHD distributes dividends quarterly by paying four times annually with a consistent schedule.
Over the past decade, SCHD has delivered around a 9-10% annual dividend growth rate and approximately 7% share-price CAGR.
SCHD offers a higher current yield (~3.9% SEC yield) and a low 0.06% expense ratio. Against VIG, it favours yield over growth; versus SPHD, it trades some yield for quality and stable growth.